Difference between revisions of "Modeler:Tutorial/Information Grammar Diagram"
m (Marcow moved page Modeler:Information Grammar Diagram to Modeler:Tutorial/Information Grammar Diagram without leaving a redirect) |
m |
||
| Line 179: | Line 179: | ||
Some printers will not print the entire diagram as shown by the preview window. (Random pieces of the diagram will be missing). In this case the diagram is to complex to fit into the printer's memory. You can prevent this problem by selecting a raster-printing option in the printer driver (instead of vector-printing). | Some printers will not print the entire diagram as shown by the preview window. (Random pieces of the diagram will be missing). In this case the diagram is to complex to fit into the printer's memory. You can prevent this problem by selecting a raster-printing option in the printer driver (instead of vector-printing). | ||
Some fonts will be displayed too large in the print preview window. In that case the font cannot be sized smaller then displayed. This has no effect on the printed result! | Some fonts will be displayed too large in the print preview window. In that case the font cannot be sized smaller then displayed. This has no effect on the printed result! | ||
---- | |||
Back: [[:Modeler:Tutorial/Classification and Qualification|Classification and Qualification]] | |||
Next: [[:Modeler:Tutorial/Editing Information Grammar|Editing Information Grammar]] | |||
[[Category:Modeler]] | [[Category:Modeler]] | ||
Revision as of 05:52, 28 February 2013
In this lesson you will learn how to build, change and configure diagrams. (Starting with the diagram you have created in the previous lesson)
Popup-menu's are frequently used in this lesson. Almost every object in a diagram has it's own popup-menu. You can activate this popup-menu by positioning the mouse cursor on the object and pressing the right mouse button. The popup-menu of the diagram itself can be activated by positioning the mouse on an emtpy area of the diagram and pressing the right mouse button.
Placing all object types and fact types
Step 6
1. Drag the following object types and fact types from the IG Viewer to the diagram:
Apprenticeship, Apprenticeship City, apprenticeship code, Apprenticeship Description, Apprenticeship Preference, Assigned Apprenticeship, description, and number.
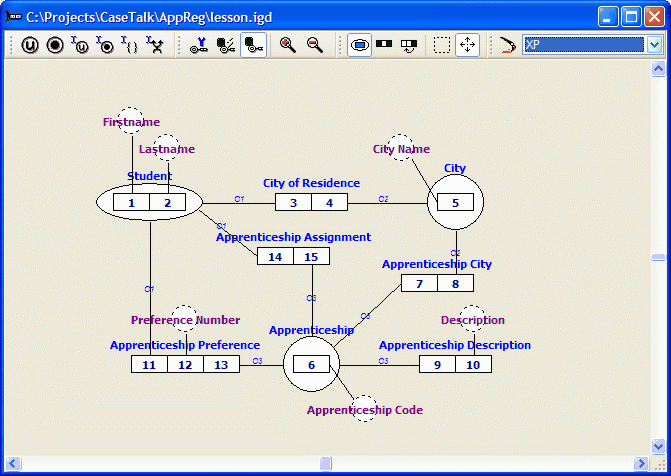
If you are working on a low resolution monitor you could use the popup menu 'Add Related'. Once you have arranged averything, you should end up with a diagram similar to this one:
Removing Objects
Step 7
1. Open the popup-menu of the 'Apprenticeship' object and select Hide.
Both 'Apprenticeship' and all lines to 'Apprenticeship' will be removed from the diagram.
Note: 'Apprenticeship' did not disappear from the Repository Window! Currently 'Apprenticeship' is the only object type / fact type in the Repository which is displayed in black. This indicates it is not placed in the active diagram. (The name of the active diagram can be found at the bottom of the Repository Window.)
2. Drag 'Apprenticeship' back to the diagram.
Moving Roles
Step 7
1. Keep the Alt-key pressed and drag role 11 on role 13:
2. Keep the Alt-key pressed and drag role 11 on role 12 to restore the diagram.
Note: As an alternative you may use the selection mode buttons in the diagram to drag roles.
Creating corner points in lines
Step 7
1. Click on the connecting line from 'Apprenticeship Preference' to 'Apprenticeship':
It is possible to select and drag corner points, they even have a popup-menu. In the popup-menu you can select options like Remove and Straight Line. It is possible to create multiple corner points in each line. If multiple points are selected, multiple points can be dragged.
2. Open the popup-menu from the corner point and select Straight Line.
Zooming diagrams in and out
1. Open the Diagram menu and select Zoom, 115%. The diagram will be enlarged.
2. Open the Diagram menu and select Zoom, Zoom Out.
Using information blocks
Step 7
1. Open the Diagram menu and select Show Diagram Info.
The Diagram menu is only available if the Diagram Designer is the active window.
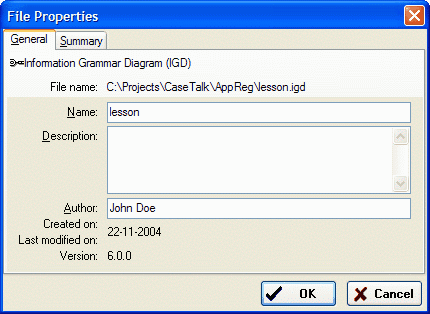
2. Select 'lesson.ig' in the Project Manager, open it's popup-menu and select File Properties.
This option is also available from the IGD Info block's popup-menu.
3. Enter the information below, then click Ok:
4. Activate the Diagram Designer window, open the IGD menu and select Show Data Type Info:
A list of all label types and the associated datatypes will be shown. Currently every datatype is 'default(1)'. The FCO-IM Casetool will generate a proposal for the datatypes during the GLR-Algorithm (Lesson 6).
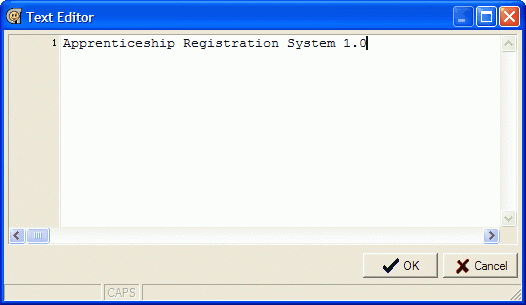
5. Open the Diagram Designer's popup-menu and select New Text Block:
Enter the text as shown below.
6. Select 'File\Apply and exit'.
7. Open the text block's popup-menu and select Show Border.
The border will be shown with a dotted-line. When printed the border will not be displayed.
8. Remove the text block by selecting Remove from it's popup-menu.
Configuring an IGD
Step 8
1. Select Properties from the Diagram Designers popup-menu:
In this example only a few options will be discussed. Press F1 for more information.
2. Activate the Fonts tab:
3. Select 'Fact type names, R indicators' from the Items list.
4. Select the 'Arial' font, size 12, color dark blue. Click Ok.
Using diagram styles
Step 9
1. Select Properies from the Diagram Designer's popup-menu.
2. Activate the Styles tab.
3. Type a new style name in the Name field:
4. Click Save and save the style. Close the IGD Properties window.
5. Activate the diagram and select the new style using the menu 'Diagram\Style'.
Configuring (multiple) objects
Step 9
1. Open the 'Student's' popup-menu and select Properties:
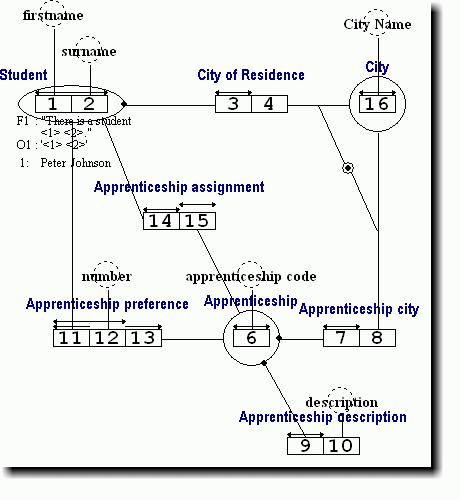
2. Select the 'Display expressions' and 'Display tupels'.
3. Select Fact name position 'Left' and click Ok.
You can change the properties of multiple objects at the same time by selecting the objects and choosing the Properties option from one of their popup-menu's. (Hold the shift-key to select multiple objects).
Using the alignment functions
Step 10
1. Keep the shift-key pressed and select 'Student', 'Assigned Apprenticeship' and 'Apprenticeship Preference'.
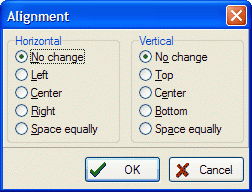
2. Select Align from the Diagram menu:
3. Select Horizontal 'Left Sides' and click Ok.
Note: The left sides of the fact types have been placed exactly on the same line.
4. Drag the fact type 'Assigned Apprenticeship' to it's original position.
Printing a diagram
Printing a diagram
Step 10
1. Select the diagram window.
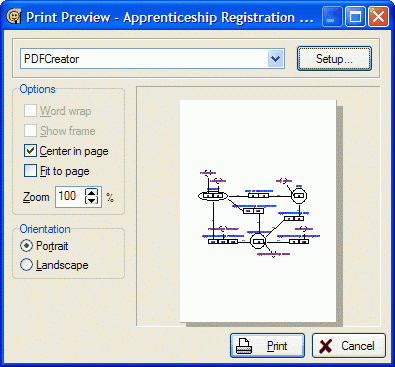
2. Open the File menu and select Print Diagram:
3. Select Fit to page.
4. Click Print to print the diagram.
5. Save the project by selecting Save Project from the File menu.
If no printers have been installed the preview area will be empty.
Some printers will not print the entire diagram as shown by the preview window. (Random pieces of the diagram will be missing). In this case the diagram is to complex to fit into the printer's memory. You can prevent this problem by selecting a raster-printing option in the printer driver (instead of vector-printing). Some fonts will be displayed too large in the print preview window. In that case the font cannot be sized smaller then displayed. This has no effect on the printed result!
